
Adaptation of on-site generation to curtail on-peak costs

Abstract
It is coincidence, in the strictest meaning of the word, that the demand for electrical energy in a manufacturing facility maximizes when the cost of that energy maximizes. Maintaining the competitive edge in business means controlling energy costs among others. Given the cost of on-peak energy and the potential for its increase under the utility deregulation scenario, businesses will be looking for ways to optimize return on equity invested in on-site generation equipment. A likely opportunity is the adaptation of installed emergency and standby power generation for peaking scenarios. This paper discusses the path followed by a manufacturer in the varied use of on-site generation for peaking power production. The variations were dictated by evolving conditions, not the least of which was environmental, over 18 years of peaking. The goal has been cost control in each of the variations. This experience is shared as objective evidence that existing on-site generation can be cost effectively deployed in a variety of operating modes to meet changing business and environmental conditions.
Introduction
The Automatic Switch Co. plant in Florham Park, NJ is approximately 600,000 ft2. It is the main manufacturing facility as well as the headquarters of the company. Approximately 40% of the floor space is dedicated to office area for such corporate functions as Sales, Marketing, Engineering, Production Planning, Finance, Human Resources, Management Information Systems, etc. The remainder is used as manufacturing space. It is basically a single shift operation. Located in the northeast, one would expect its energy profile to vary over the course of the year. While the monthly peak demand varies somewhat, the monthly profile of electric energy demand remains relatively constant. Load factor varied from about 0.49 to 0.57. (Load factors of 0.6 or less indicate the potential viability of peaking operation.)
The facility HVAC system is comprised of about 22 roof top units feeding dedicated zones throughout the office area. Total HVAC load is approximately 800 kW. This comprises the largest variable load. Over the years, the shop lighting was changed to HID and the office changed to energy efficient fluorescent fixtures. Where task lighting is used, it is fed from local convenience outlets. Shop machinery basically consists of a few NC machine and short run molding centers, light duty copper welding and hand tools. A significant amount of compressed air is used for automated production machinery, tools and product testing. The remaining load is comprised of an MIS facility fed through a 180kw UPS, desk top PCs, work stations, printers, plotters and copiers. There is no group of loads that can be curtailed or scheduled without impacting productivity. Therefore, turning off selected loads is not an option for this facility.
Initial standby power system
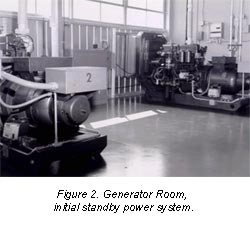
Prior to 1980, the on-site power system was comprised of two 75 kWe diesel generator sets arranged to provide emergency power through a three source priority load transfer system. The single line diagram of this system is shown in figure 1. Figure 2 is a photograph of the engine generator room. Since automatic transfer switches and power control systems are principal products of this manufacturing facility, the generators were also used in production testing of power control system products. The installed power system was arranged to automatically revert to the emergency mode should a power failure occur while a product test was underway.
 The engines were retrofitted with electronic load sharing governors for kWe sharing. The generators were retrofitted with reactive load compensation voltage regulators for kVAR sharing to accommodate product testing. Upon sensing loss of power at either of the ATS's, the system controls terminate the production test mode and switch the generator outputs to the priority load transfer switch. If the generators were not in use for testing when the loss of power occurred, the engines would be automatically started. The first generator set to achieve operating parameters would be transferred to the priority 1 ATS by the PLTS. The priority 2 loads would be transferred to the remaining standby set when it started and assumed nominal operating parameters.
A number of iterations occurred in the evolution of the onsite power capability to be responsive to the changing electric cost environment. The eventual mode of operation will evolve as a balance of sometimes competing concerns. The issues driving the concerns come from many sectors. As will be seen, a number of factors influenced plant design decisions along the way. However, operating cost and return on investment were primary considerations in the final decision in each case. The remainder of the paper will discuss how the plant was changed over the years. The underlying facts demonstrate how readily renovations can be made to on-site generation to meet dispersed generation / peaking opportunities.
The case for cogeneration
In the late 1970s Congress passed the PURPA (Public Utilities Regulatory Policies Act) Legislation. Among other provisions, this act and FERC (Federal Energy Regulatory Commission) regulations required that access to operate in parallel on the utility power grid be granted to cogenerators meeting certain efficiency requirements. The advantage of parallel operation of cogeneration lies in the ability to operate the plant at the most fuel efficient point. When operated in parallel with the grid, the plant could produce as much or as little electricity as necessary to meet the heat flow need. The result is through put energy conversion efficiencies in excess of 60%. At the time, this was in excess of two times the efficiency of many fossil fueled utility generating plants, particularly those used for peaking power.
Electric utility rates are typically structured to charge industrial and commercial users for the full cost of electricity. Typical rates will include an energy charge, demand charge and fuel adjustment charge. They may also assess charges for reactive power, any special infrastructure and other factors. The major charges are summarized as follows:
Energy charge
The energy charge is assessed for the number of kilowatthours used in a billing period. This charge is typically assessed at cents per kWh based on the amount and the time of day during which the energy is used. The usual division is on peak and off peak. Some utilities also have a semi peak period. With respect to cost, on peak kWh cost more than off peak kWh.
Demand chargeThis charge is based on the rate at which the energy is used per period. The period will be 5, 15, or 30 minutes. The charge is assessed in dollars per kW. The calculation is made by choosing the single highest demand period in a billing month.
Fuel adjustment charge
This charge is assessed in cents per kWh. It reflects the difference in fuel cost to produce the energy. That difference is the result of a fluctuating fuel commodity charge over the intervening time since the rate setting agency set the energy charge.
The electric bill for the month corresponding to the demand curve mentioned in the introduction, is calculated as follows:
Were the present rates applied to that usage, the bill would have been $77,345.60. Given the present usage and rates, the bill for that same month in the most recent year was $94,623.49.
The resources for funding alternative means of providing the required energy must come from the savings generated from the alternative means. The savings are the moneys remaining after the cost of producing the energy is accounted for. These savings must make sufficient return on the investment to justify the expenditure for the plant.
An aside, as is the case with virtually any industrial or commercial opportunity, the primary business will not be the production of electricity. There is likely to be no resident staff qualified to operate and manage an electric power production plant. Therefore, any investment of the business's resources in the production of electric energy must compete with investment opportunities associated with the core business.
Every facility uses energy in multiple forms. In the overwhelming number of cases the two most common forms are thermal and electrical. In some cases, the electrical energy produces all or portions of the thermal energy as well. For example, facility cooling can be provided by chillers. The chillers can be centrifugal or absorption. The centrifugal are electric; the absorption can be gas, hot water or steam fired. That hot water and steam can come from any number of sources, one of which could be the heat recovery system of an electric generation process. Typical throughput efficiencies of generation processes vary with respect to the type of prime mover. As an illustration, a reciprocating diesel engine driven generator, (1200 or 1800 rpm) will be about 34 % efficient in converting the energy content in a unit of fuel to output kwh of electricity. A combustion turbine will be about 25% efficient in the same measure. If heat recovery is added to each of these generation processes and energy recovery is optimized, the reciprocating diesel generation process will rise to above 75% efficiency and the combustion turbine process will rise to above 80% efficiency. For common understanding, through put efficiency is defined here as that percent of the energy content in the unit of fuel converted to usable energy at the output of the process. It is a given that 1 kWhe = 3413 BTU. Thus if the fuel were #2 oil, whose energy content is 144000 BTU per gallon, at 34 % efficiency, the reciprocating diesel engine would produce 14.34 kWh/gal. Whereas the combustion turbine would produce 10.55 kWh/gal. Adding heat recovery to the processes, the efficiencies would change to 31.64 and 33.75 equivalent kWh/gal, respectively. It can now be understood why, the issue of heat recovery is a significant decision in selecting the operating strategy.
With respect to cost, if #2 oil cost $.55/gal., the fuel cost of generating with the reciprocating diesel process would be $.038/kWh and that for the turbine would be $.052/kWh. When the operating cost of the generation process accounts for maintenance of the prime movers, an additional $.015/kWh is added. Without heat recovery, estimated total cost of generation for each scenario would be $.053/kWh and $.067/kWh, respectively. Table 1 presents various projected energy costs for differing cost of fuel. As can be expected, the best cost performance, minimum cost for displacement kWh by on site generation, will be with the combustion turbine with heat recovery. Throughout the evaluation process, the impact of design decisions on the final capital and operating cost must be kept in mind. If operating cost per kWh were the only consideration, the operating strategy decision would be simple. 1
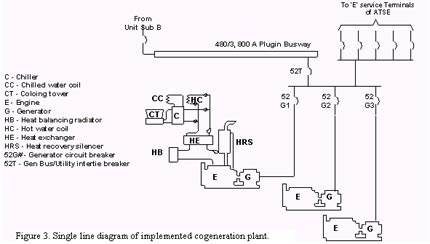
At the time of the analysis for the cogeneration plant, there were two 50 ton HVAC units requiring replacement. There was also a hot water heating load that could use the heat from the plant for winter heating. The integration of absorption chilling into the cogeneration plant design could provide additional savings. The analysis of operating costs for energy, showed that it would be feasible to produce a portion of the plant's electric energy needs during the on-peak period. It would not have been economically justifiable to produce the total electric energy need of the plant. Given the need for 100 tons of air conditioning, the plant sizing starting point became one of producing the 100 tons of AC. It was found that this cooling need could be satisfied with a 430 kW diesel generator having hot water heat recovery. (Diesel fuel was selected because its cost at the time, was less than that of natural gas and the cost of the prime mover, per kW, for a diesel engine was substantially less than that of a gas fired engine.) The plant design became a diesel generator with jacket water and exhaust heat recovery and hot water fired absorption chillers. It was also decided to integrate the existing 75 kW emergency generator sets into the plant design. The expectation was that the in-house need for emergency power would continue to grow. Given that the cogeneration plant was diesel fueled, it would also serve as an emergency power plant. Figure 3 is a line diagram of the plant as it was implemented.
The implementation of the plant with the 100 tons of AC paid an additional dividend in the further reduction of the on-peak kW demand of about 120 kW. This was the energy requirement of the two 50 ton refrigeration machines. Since the AC was required only when the plant office area was in use, it was only necessary to operate the plant during working days. Consequently, the plant was operated for approximately 2880 hours annually. The financial analysis indicated annual savings to be $84, 360. This was based on peaking operation. If the plant were operated as a base load plant, the savings were projected to be $106,529. However, since there was no 24/7 need for the cooling capacity, base load operation was not an alternative. Given the prevailing economic conditions of the time, the plant could be installed with an estimated payback period of 2.75 years. 2
The power plant
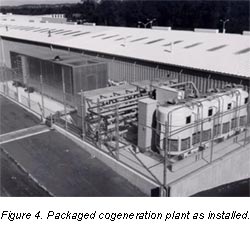 The cogeneration plant was implemented as a packaged plant. In the photograph of figure 4, the equipment is identified left to right as, the engine generator and heat recovery module, 8 manifolded 12.5 ton absorption chillers and 4 cooling towers. Its electric power output was fed to a three engine synchronizing switchgear integrating the existing diesel generators. The key to efficiency was operation of the generator in parallel with the utility derived service. The engine controls were equipped with a loading control and the generators, with VAR/pf controls. Since the plant achieved qualified status, access to parallel operation was assured by PURPA and FERC. In a discussion with the serving utility, it was agreed that the rating of the generator was small in comparison to the utility service and plant load. Should the utility service fail while the plant was operating in parallel with it, the generator would be subjected to what would appear to be a fault. With this size disparity, protective relaying for the point of common connection of the plant was significantly simplified. A three phase instantaneous overcurrent relay set at the per unit rating of the generator would serve to separate the sources immediately upon loss or reduction of the utility service. The Device 27 undervoltage and 81 under/overfrequency relays served as permissive relays to establish a precondition for initiating parallel operation. An expanded single line diagram of the plant power system is shown in figure 5. The protective relays were located at the switchgear where the generator output fed the in house plugin busway. This is approximately 800 ft. from the associated feeder breaker in Swgr. A. Figure 6 shows the generator switchgear. Beginning at the left, the layout is
Sec. 1 – Gen 1 - Cogeneration EG set power and control
Sec. 2 – Gen 2 - Stand by deisel generator set
Sec. 3 – Gen 3 - Stand by diesel generator set
Sec. 4 - System control
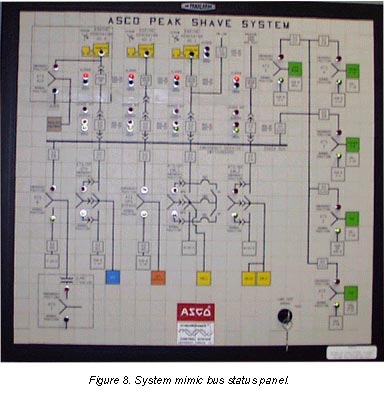
Sec. 5 – System Mimic Bus and status
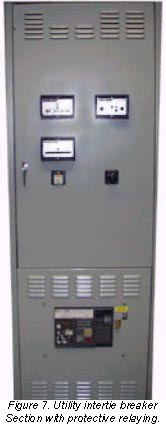
Sec. 6 – Utility intertie breaker and protective relaying
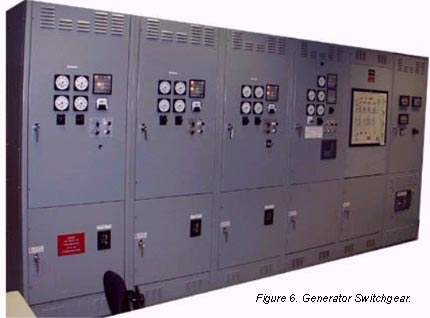
Figure 7 is a close up of Sec. 6 showing the extent of protective relaying. Figure 8 is a close up of the Mimic Bus Status panel. The LEDs integrated into the mimic bus reflect system and device status through color coding.
Power generated by the cogeneration plant was completely consumed within the confines of the facility. This power served to reduce the demand on the utility service. Figure 9 is a plot of the electric demand profile with the cogenerated electrical energy shown in the shaded area. Due to lower than expected fuel cost, the plant operating cost was less than projected.
The next phase
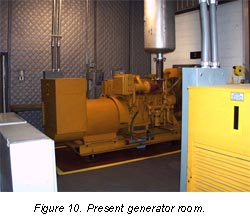
In the early 90's, the state environmental protection agency passed a regulation requiring air pollution abatement equipment for stationary diesel engines operating over 500 hrs. annually. As a result, service as a cogeneration plant was discontinued. After a period of time, the absorption chillers and cooling towers were removed. The plant was reconfigured to operate as a stand by power plant. With the proliferation of PC's, work stations and network, and migrations to modern manufacturing centers, the facility and emergency load demand had grown significantly. Electric demand for the calendar month of the profile shown in fig. 1 had grown to 2216 kW in 1998. As a result, it was desirable to increase the rating of the stand by power plant. Simultaneously, the serving utility had implemented a Demand Side Management program. This program encouraged large users of electric energy to take steps to reduce their electric demand. Given the infrastructure of the cogeneration plant, engine generators and switchgear, an opportunity was presented. As a user, the company could contract to provide a defined demand reduction upon notification from the utility, of the need. The terms were that the call would be made a limited number of times in any given year for a predetermined maximum period. In consideration for this, the electric rate structure would provide a financial incentive. That incentive created the savings potential that would justify the replacement of the original 75 kW diesel generators with two 255 kW sets. This change would permit the plant to meet the expanded emergency load requirement of the facility. The original switchgear was designed and manufactured with the intent of replacing these two smaller sets with larger ones at some future point in time. Consequently, only control circuit changes were necessary to integrate the larger sets. Figure 10 shows the generator room as it is now configured. The mimic bus status panel shows the system as it is now configured.
 Both closed and open transition transfer switches were included in the ATS profile. The closed transition switches enabled peak reduction operation of loads that were vulnerable to short duration power interruptions. Open transition transfer switches with inphase transfer control were used on machine loads. 3 One of the significant design decisions that enabled the installed infrastructure to be so readily adapted to the changing role of the power plant, was the implementation of control strategy in a programmable logic controller. As emerging technology was integrated into emergency power equipment, the ability to communicate and make decisions based on changing scenarios became common place. ATS's were furnished with microprocessor controls enabling the orchestration of system operation. Loads could be transferred and retransferred based on bus capacity. Load priorities could be based on real time power demand matched to real time capacity. As the power system stands today, there are 10 ATS's that can be individually addressed for transfer and retransfer to respond to any need for power. Distributed data gathering at each ATS and the generator switchgear enables the capture of real time operating data and historical performance for trend analysis.
Emerging trend
There is a major shift in the electric utility business today. It is deregulation and it is upon us. Effectively, deregulation separates the large scale generation of electricity from the large scale distribution of that energy. In essence, since there will be two separate entities, generation and transmission / distribution, each will have to operate to make a profit. A free market environment will emerge. No longer will generators be able to lump the cost of generation for sources in its mix. Generators of electricity will be bidding to provide energy to what will develop into a spot commodity market. Users on the other hand can not significantly change the rate at which they demand energy without affecting the manner in which they do business. Consequently, users will still impose daily peak demands. With electricity trading as a commodity and the peak energy being produced by the less efficient power plants, the cost of on-peak energy to the user will most certainly increase. In a recent summer month, a Midwest utility system saw a peak energy cost of $7,000.00 per MWh. That is $7.00 per kWh. While costs of this magnitude are not likely to be common place thing, market forces are going to raise the cost of electricity. For this reason, more and more industrial and commercial users of electricity will be looking for ways to reduce and control their cost of energy.
The installed base of standby and emergency engine generators can provide a rapid response to this expected need. There will be a varied response to the application of this power. As can be seen from this presentation, parallel operation of on site generation is not the only way to respond to this need. Where parallel operation is desired, protective relaying at the point of common coupling need not be prohibitive, particularly where the generation is reasonably small when compared with the utility service capacity. Changes to and enhancements of installed standby and emergency power systems will find ready funding from savings to be gained from their use in controlling the cost of purchased electric power. The ready availability of distributed processing and data gathering in automatic transfer switches and generator control switchgear makes it possible to develop a unique control strategy that can cause this installed base to be responsive to the volatility of the commodity price of electric energy. Since it can be programmed, it will not require any addition in staffing to man the power plants. The requirement for facilities managers to be knowledgeable in the management of energy usage will be responsive to this emerging need. The infrastructure at the Automatic Switch Company plant is well situated to take advantage of evolving needs.
To contact Daley, email jdaley@asco.com